
Source codeResLibCal does not require iFit to be installed, and can be used as a separate application. However, to benefit from the 4D convolution feature, it is advised to install iFit, which includes ResLibCal.
The package can be obtained here [ZIP 220 ko]. You can also browse the source code here or get a copy.
It does not depend on any other toolbox/library, except Matlab. Simply extract the application archive.
In addition, the legacy RESCAL code is also made available as [Fortran code].
Binary pre-compiled (no need for Matlab)
It comes pre-installed in the iFit standalone distribution.
>> ResLibCal;If you use the source code distribution (requires a Matlab license), type:
>> addpath(genpath('/path/to/ResLibCal'))If you use the standalone (binary compiled, no need for a Matlab license) application, launch the application from iFit by starting:
% ifit ResLibCalfrom iFit standalone:
>> ResLibCal
The Cooper-Nathans [1] method handles a conventional description of the instrument, with collimations and homogeneous mosaic spread.The analytical methods, Cooper-Nathans and Popovici, define the resolution matrix as [3]:
The Popovici method [3] handles similarly collimations and mosaic spreads (but here with separate horizontal and vertical components), but also much more geometrical details, including the optical elements size, and the radius of curvature of the monochromator and analyzer. Modern TAS machines mostly use optics focusing so that this method is probably more suited to model today's spectrometers.
The Full Monte-Carlo uses a Monte-Carlo instrument simulation with McStas (templateTAS instrument) to evaluate the resolution as a cloud of points in the reciprocal space. This cloud can then be used for 4D convolution.
The Cooper-Nathans/AFILL method uses the Chesser and Axe intensity estimate [2], whereas all the other methods use the Popovici formulation [3]. The intensity estimate is given w.r.t the source, and is given in [a.u.]. The monochromator and analyzer reflectivity is assumed to be ideal (1).Collimation:
The intensity with the Full Monte-Carlo model provides the best estimate.
In all methods, the alpha/beta collimation parameters support guide m-coating specification (negative values e.g. -2) which are then converted to equivalent critical angles 0.1 m λi [deg]. The alpha/beta collimations are also limited by the effective divergence set from the geometry, e.g. atan(width or height/distance) [rad].Mosaic spread:
The collimations with the Full Monte-Carlo model provides the best estimate, as they are indeed modeled as Soller type collimators.
The sample mosaic spread is also taken into account, as well as a correction for the sample orientation w.r.t. the incoming beam.
In the legacy Cooper-Nathans formalism, all mosaic spreads are isotropic (monochromator, analyzer, sample). In the Cooper-Nathans/Popovici formalism, mosaicity supports separate vertical and horizontal components, including correction [7].
In the Popovici formalism, all mosaicities are taken into account with separate vertical and horizontal components (monochromator, analyzer, sample).
The mosaicities with the Full Monte-Carlo model are assumed with a gaussian reflectivity profile.
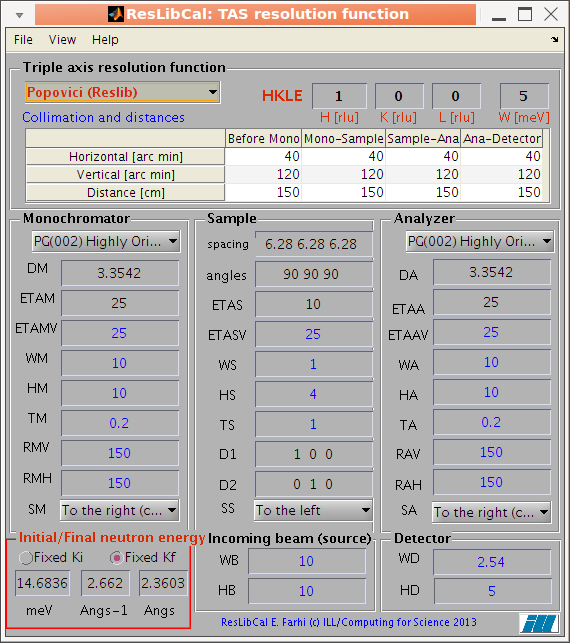
The main interface present all parameters required to configure a
Cooper-Nathans or Popovici computation. All items have a
contextual help (bring the mouse pointer over to display a short
tool-tip, with signification and units). Parameters indicated in blue are used only in
for the Popovici method. Parameters in red are those which the user should
mostly change (incident energy, position of measurement HKLE) once
the instrument configuration has been set.
The Q and Energy transfer are defined as:
The main parameter categories are:
When any value is changed, an automatic re-computation is
performed if the View/Auto-update
menu item is checked (which is the default).
The result of the computation can be displayed from the View
menu in 2D and 3D, as well as the instrument geometry.
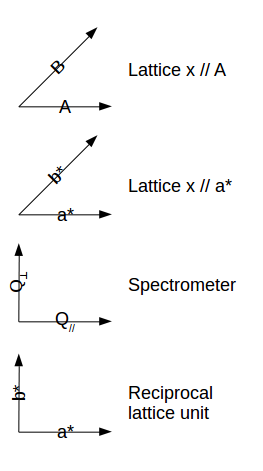
The resolution matrix is then shown in reciprocal lattice units (rlu) [a*,b*,E] or
inverse Angstroem (Angs-1) [Qx,Qy,E or A,B,E] . You can
select the coordinate frame used for displaying the resolution in
the Un-checking the Resolution in ... sub-menu in the View menu. See below for a description of the
available coordinate frames. It is also possible to plot the
resolution function projections in the vertical [Qz, c* or
C] axis instead of the energy E axis by toggling the View
menu, e.g. Resolution in [Qx,Qy,E] item.
The resolution matrix is always computed in [Angs-3.meV],
but it can be shown in [rlu3.meV] in the 2D and 3D
views.
DM Monochromator d-spacing
DA Analyzer d-spacing
ETAM Monochromator mosaic
ETAA Analyzer mosaic
ETAS Sample mosaic
SM scattering sense frocdm monochromator +1=right, -1=left
SS scattering sense from sample +1=right, -1=left
SA scattering sense from analyzer +1=right, -1=left
KFIX fixed neutron wavevector in Ang.-1
FX index for fixed wavevector 1=incident 2=final (10)
ALF1 horizontal source-mono. collimation in min (FWHM)
ALF2 horizontal mono.-sample collimation in min (FWHM)
ALF3 horizontal sample-analyser collimation in min (FWHM)
ALF4 horizontal analyser-detector collimation in min (FWHM)
BET1 vertical source-mono.  collimation in min (FWHM)
BET2 vertical mono.-sample collimation in min (FWHM)
BET3 vertical sample-analyser collimation in min (FWHM)
BET4 vertical analyser-detector collimation in min (FWHM)
AS sample lattice parameter a in Angs.
BS sample lattice parameter b in Angs.
CS sample lattice parameter c in Angs.
AA (alpha) angle in deg. between axes b and c
BB (beta)  angle in deg. between axes a and c
CC (gamma) angle in deg. between axes a and b
AX First wavevector in scattering plane coordinate H (rlu). angle <KI,A>=A3
AY First wavevector in scattering plane coordinate K (rlu)
AZ First wavevector in scattering plane coordinate L (rlu)
BX Second wavevector in scattering plane coordinate H (rlu)
BY Second wavevector in scattering plane coordinate K (rlu)
BZ Second wavevector inou scattering plane coordinate L (rlu)
QH Position of resolution wavevector (center of measurement) H (rlu)
QK Position of resolution wavevector (center of measurement) K (rlu)
QL Position of resolution wavevector (center of measurement) L (rlu)
EN (W) Position of resolution wavevector (center of measurement) W (meV)
DQH Increment of Q,E defining general scan step along QH (rlu)
DQK Increment of Q,E defining general scan step along QK (rlu)
DQL Increment of Q,E defining general scan step along QL (rlu)
DEN Increment of Q,E defining general scan step along EN (meV)
GH Gradient of the dispersion (planar) direction along QH (rlu)
GK Gradient of the dispersion (planar) direction along QK (rlu)
GL Gradient of the dispersion (planar) direction along QL (rlu)
GMOD  Gradient of the dispersion (planar) direction along EN (meV)
BeamShape =0 for circular source, =1 for rectangular source
WB width/diameter of the source (cm)
HB height/diameter of the source (cm)
Guide =0 No Guide, =1 for Guide
GDH horizontal guide divergence (minutes/Angs)
GDV vertical guide divergence (minutes/Angs)
SampleShape =0 for cylindrical sample, =1 for cuboid sample
WS sample width/diameter perp. to Q (cm)
TS sample width/diameter along Q (cm)
HS sample height (cm) (10)
DetectorShape =0 for circular detector, =1 for rectangular detector
WD width/diameter of the detector (cm)
HD height/diameter of the detector (cm)
TM thickness of monochromator (cm)
WM width of monochromator (cm)
HM height of monochromator (cm)
TA thickness of analyser (cm)
WA width of analyser (cm)
HA height of analyser (cm)
L1 distance between source and monochromator (cm)
L2 distance between monochromator and sample (cm)
L3 distance between sample and analyser (cm)
L4 distance between analyser and detector (cm)
RMH horizontal radius of curvature of monochromator (cm)
RMV vertical radius of curvature of monochromator (cm)
RAH horizontal radius of curvature of analyser (cm)
RAV vertical radius of curvature of analyser (cm)
>> ResLibCal('view2')
>> ResLibCal('view3')
>> ResLibCal('geometry')
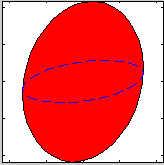
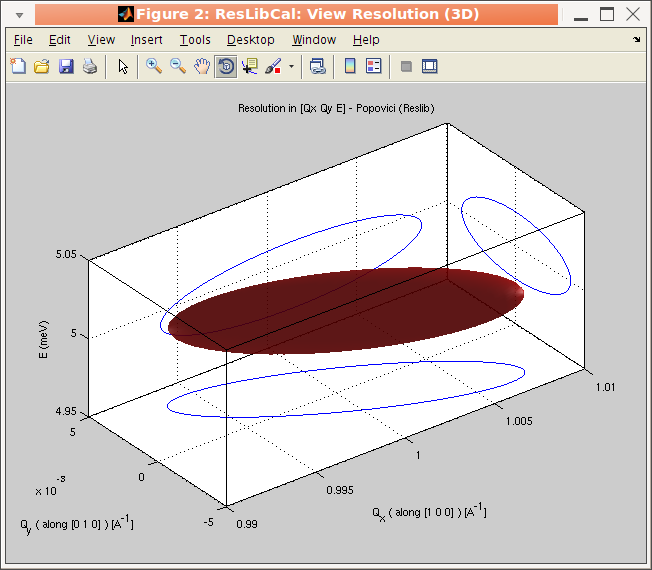
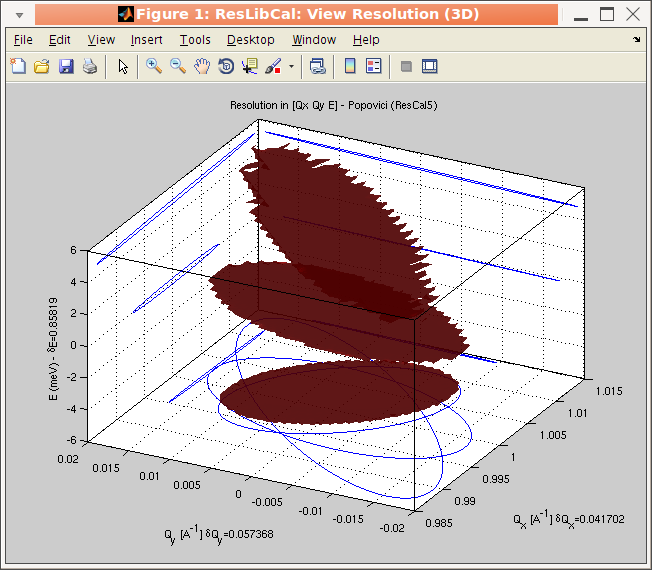
For the 2D and 3D view, it is possible to display the resolution
volume as a cloud of points computed randomly with a gaussian
distribution from the resolution matrix. When using the Full
Monte-Carlo computational method, the cloud is ontained directly
from the TAS model (McStas), and the resolution matrix is computed
from the half width distribution. The cloud view is shown when
selecting the Overlay Monte-carlo cloud item in the View
menu. The number of points computed can be set with the Set
Monte-Carlo iterations item (e.g. 200), but in all cases, in
order to render the plot faster, the distribution is shown with
not more than a few hundred points.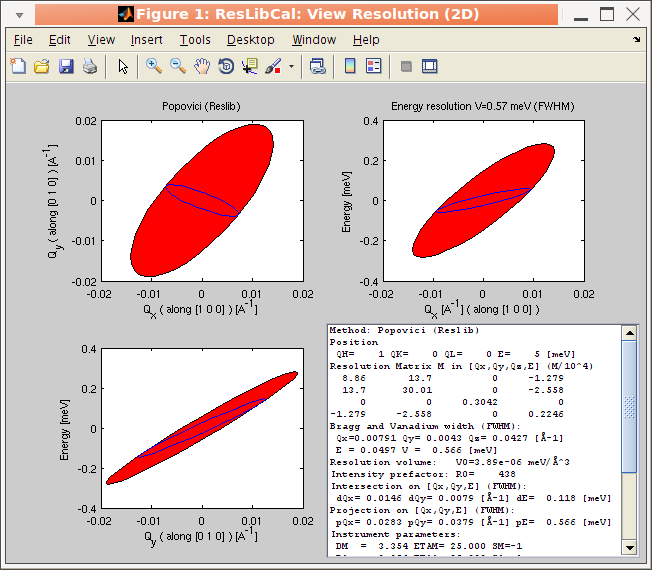
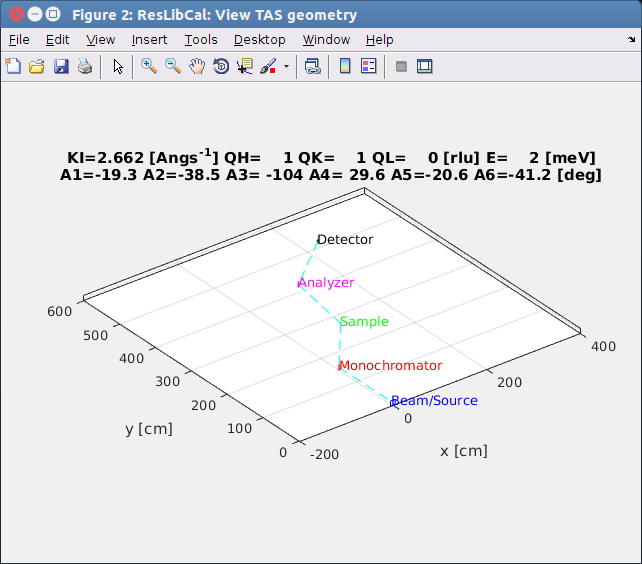
A1  rotation angle of the monochromator. A1=0 means the crystal is in grazing incidence.
A2  scattering angle (take-off) from the monochromator, usually A2=2*A1 in scattering condition.
A3  orientation angle of the crystal lattice in real space. This is the angle between KI and vector A=(AX,AY,AZ)
A4  scattering angle (take-off) from the sample. Usually A4 is NOT 2*A3.
A5  rotation angle of the analyser. A5=0 means the crystal is in grazing incidence.
A6  scattering angle (take-off) from the analyser, usually A6=2*A5 in scattering condition.
 Any HKLE
setting can be assign a vector, so that the resolution will be
computed, and plotted in GUI mode for all measurements. The
vector should be set as values separated by spaces.
Any HKLE
setting can be assign a vector, so that the resolution will be
computed, and plotted in GUI mode for all measurements. The
vector should be set as values separated by spaces.Getting configuration from other packages:In addition, the 'File/Open Instrument...' menu item allows to read a predefined TAS instrument configuration. These instruments are stored in the ResLibCal/instruments directory. Such files should preferably be '.ini' files, but any other supported configuration format also works. We currently provide such files for IN1 IN8 IN14 IN20 IN22 MLZ_TRISP. You may add files in this location with your preferred configurations by just copying and renaming e.g. any ResLibCal.ini file.
The *.res files can be generated by ResTrax. This is a list of NAME=VALUE pairs.
The *.par and *.cfg files can be generated by ResCal5.
The *.par files can be generated by the legacy ResCal code (42 values in a column).
ResTrax can also generate *.cfg files (different format than ResCal5), which only specify a reduced set of parameters (we refer to these as 'rtx' files when exporting to avoid confusion).
Rescal legacy format (*.dat):
If the output file name you specify has a 'dat' extension, the generated configuration uses the ResCal legacy format, which consists in 42 numbers.
Rescal legacy format (*.par and *.cfg) with comments:The main ResLibCal GUI can also be exported as graphics image in a set of formats (File/Export menu item), including PDF, EPS, PNG, TIFF, BMP, and Matlab Fig. Plot windows can be exported using their File/Saveas menu item, and printed.
If the output file name you specify has a 'par' or 'cfg' extension, the generated configuration uses the ResCal legacy format, which consists in 42 numbers. Comments are added for easier parameter identification. An additional cfg file with Popovici parameters will also be written. These files can be read by the legacy ResCal and ResCal5.
ResTrax/ResCal format (*.res):
If the output file name you specify has a 'res' extension, the generated configuration uses a simple 'NAME = value' list of parameters. Such files can be read by ResTrax.
ResTrax legacy format (*.rtx):
If the output file name you specify has a 'rtx' extension, the generated configuration uses the ResTrax legacy format. This type of file only exports a reduced number of parameters.
HTML report (*.html)
Save the whole configuration and results, including the 2D/3D/geometry views, into an HTML document.
>> out = ResLibCal('config_file')The file can be a saved ResLibCal configuration (see below), a ResCal5 configuration (42 or 27 numbers), or any file with named Rescal parameters, such as in an ILL TAS data ascii file. Alternatively, an EXP ResLib or full ResLibCal configuration structure can be sent, as well as a ResCal parameter list.
ans =
Title: 'ResLibCal configuration'
handle: 173.0160
EXP: [1x1 struct]
resolution: [1x1 struct]
ResCal: [1x1 struct]
>> out = ResLibCal('DA=3.355; DM=3.355; ...') % change the configuration and recompute resolution
In order to modify an existing configuration ResLib EXP or full ResLibCal out, use:>> out = ResLibCal(out or EXP structure, 'DA=3.355; DM=3.355; ...')For a given configuration (from file, or GUI), the resolution can be computed in the reciprocal space with e.g. :
>> out = ResLibCal(out or EXP structure, 'file')
>> out = ResLibCal(2,0,0,5) % computes at HKLE=[2 0 0 5] coordinates in r.l.uThe resolution result is then available in 'out.resolution' and more specifically in its Bragg and RM fields of the [rlu] and [spec] sub-structures, depending on the reference frame used (see above):
>> out = ResLibCal('QH=2 W=5') % same as above but giving configuration as a string with named parameters
>> out.resolutionThe resolution matrix is computed in the laboratory frame x//Q [spec] and the lattice frame x//a* [rlu]. These two computations are stored in the [spec] and the [rlu] fields. In these fields, such as out.resolution.rlu above, 'RM' is the resolution matrix, and the 'Bragg' holds the width along frame axes as well as the the Bragg energy width (4-th value) and Vanadium width (5-th value).
focus: [80.0088 439.4046 49.7513 136.3181]
R0: 16.5334 % the intensity
HKLE: [2 1 0 5] % the HKLE rlu.meV coordinate of this point
method: 'Popovici (ResLib)'
README: {2x1 cell}
spec: [1x1 struct] % spectrometer frame
rlu: [1x1 struct] % lattice frame [a*, b*, c*]
cart: [1x1 struct]
rlu_ABC: [1x1 struct]
ABC: [1x1 struct]
angles: [25.2592 50.5184 14.3768 -70.9737 37.1658 74.3316] % A1-6 angles in a TAS machine
Q: 2.2361
>> out.resolution.rlu
cart2frame: [3x3 double]
rlu2frame: [3x3 double]
Q: [3x1 double]
RM: [4x4 double]
README: '[R] rlu lattice frame, xyz=[a* b* c*]'
unit: 'rlu'
frame: [3x3 double]
frameUnit: '1/\C5'
frameStr: {1x3 cell}
Bragg: [5x1 double]
cloud: {[2000x1 double] [2000x1 double] [2000x1 double] [2000x1 double]}
>> out.ResCalYou can change any configuration parameter, including the method for the computation:
ans =
DM: 3.3542
DA: 3.3542
ETAM: 30
ETAA: 25
ETAS: 5
SM: -1
SS: 1
SA: -1
KFIX: 2.6620
FX: 2
ALF1: 40
ALF2: 40
ALF3: 40
ALF4: 40
BET1: 120
BET2: 159.9648
BET3: 120
BET4: 120
AS: 6.2800
BS: 6.2800
CS: 6.2800
AA: 90
BB: 90
CC: 90
: 1
AY: 0
AZ: 0
BX: 0
BY: 1
BZ: 0
QH: 2
QK: 0
QL: 0
EN: 0
DQH: 0
DQK: 0
DQL: 0
DEN: 1
GH: 0
GK: 0
GL: 1
GMOD: 0
BeamShape: 1
WB: 10
HB: 10
Guide: 0
GDH: 0
GDV: 0
SampleShape: 1
WS: 1
TS: 1
HS: 4
DetectorShape: 1
WD: 2.5400
HD: 5
TM: 0.2000
WM: 10
HM: 10
TA: 0.2000
WA: 10
HA: 10
L1: 150
L2: 150
L3: 150
L4: 150
RMH: 0.0067
RMV: 0.0067
RAH: 0.0067
RAV: 0.0067
>> out=ResLibCal; % contains the ResLib structure as out.EXPThe method should mention 'Cooper-Nathans' or 'Popovici', with a flavour 'ResLib','ResCal', 'AFILL' or 'Res3' as free text.
>> out.EXP.method = 'Cooper-Nathans ResCal'
>> [ out.EXP.QH out.EXP.QK out.EXP.QL out.EXP.W ]The full list of ResLib parameters are described in the ResLib package documentation.
ans =
2 0 0 0
>> out.EXP.W = 1; % change the position in reciprocal space
>> out = ResLibCal(out); % request a new computation with modified choices
| ResLibCal('action') |
Description |
| open |
open a configuration file (par, cfg, res,
ini, m): ResLibCal('open','file') |
| save |
save the configuration in the Preference
directory (ini format) |
| saveas |
save the configuration into a specified file/format: ResLibCal('saveas','file') |
| exit |
close all active views, and save current
configuration |
| reset |
re-load the default configuration |
| create |
open the main GUI (start interface), and read
last saved configuration |
| compute |
only compute the matrix (no
plotting/printing) |
| update |
compute, and then update open views, or send
result to the console |
| view2 |
display the 2D view (resolution projections) |
| view3 |
display the 3D view (resolution) |
| geometry or tas |
display the spectrometer geometry |
| close |
close the 2D, 3D and TAS view windows |
| default |
same as create, but does not read
last configuration (using reset configuration) |
| resol |
print-out the resolution matrix a la
RESCAL |
| bragg |
print-out the Bragg widths a la RESCAL |
| list |
print-out the list of parameters a la RESCAL |
| version |
print-out the ResLibCal version |
| export |
dump the main ResLibCal window into a file |
| print |
build a ready-to-print document with
configuration, results and views (HTML) |
| quit |
same as exit, but does not save the
configuration |
| silent |
Consecutive commands (in the same call) are
executed in silent mode, with only computation of the
resolution, and no plot nor text display. |
| hkle |
Returns the current HKLE location, or empty
when the interface is not opened. |
| config |
Returns the current ResLibCal configuration. |
>> s_tas = conv(s, 'tas')The convolved model 's_tas' has the same parameters as the initial model 's', but includes the 4D convolution. When typing this command, ResLibCal is started if not already opened. To properly use this feature, you need iFit to be fully installed (the ResLibCal application alone is not enough). When ResLibCal is opened, its configuration is used to compute the resolution. If it is closed, the last saved configuration is used.
>> s_tas = ResLibCal(s);
>> s = sqw_cubic_monoatomic;The number of Monte-Carlo points used for each convolution step is by default 200. This can be changed, e.g. to speed-up the computation at the cost of a coarser results (more noisy), by changing it from the menu item 'View/Set Monte-Carlo iterations...', or from the EXP.NMC ResLib structure (out.EXP.NMC when returned from ResLibCal). When using the Full Monte-Carlo computation, more than NMC points can be generated in the cloud, so that the resolution matrices can be computed with enough accuracy.
>> plot3(s); % plot the dispersion in 3D
>> figure; plot(s); % plot the dispersion along principal axes and vDOS >> ResLibCal('ILL_IN20'); % set the IN20 TAS configuration at the ILL (in 'ResLibCal/instruments' directory)
>> s_tas = conv(s, 'tas')
>> s_tas = ResLibCal(s);
>> d_4d = ResLibCal(d);will search for (Qhkl E) Axes and extend the data set dimensionality. In addition, if the data set contains a 4D model (as 'Model' alias), it will also be convoluted by the 4D TAS resolution.
| S(q,w) |
Description |
Dimensionality |
Parameters |
| sqw_sine3d | Phonon dispersions as sine wave in HKL (3D) with a damped harmonic oscillator energy dispersion | 4D (HKLw)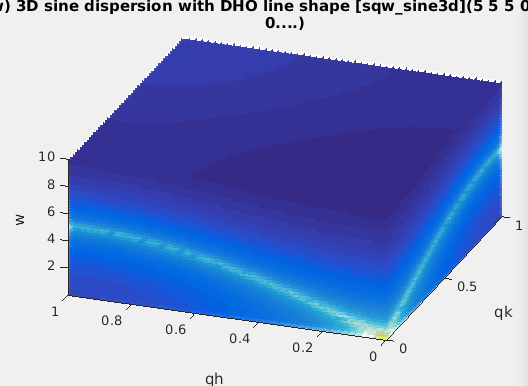 |
zone center, energy gaps, periodicity |
| sqw_vaks | Phonon dispersions in perovskite cubic crystals using the Vaks parameterisation | 4D (HKLw) |
acoustic and optical , coupling parameters,
soft mode frequency |
| sqw_cubic_monoatomic | Phonon dispersions in a monoatomic cubic crystal using the Dynamical matrix. | 4D (HKLw) |
acoustic force constant ratio and scaling
energy |
| sqw_phonons | Phonon dispersions from the Dynamical matrix, using forces estimated by ab-initio usingASE and a selection of DFT codes (EMT, GPAW, ABINIT, Elk, Dacapo, NWChem, QuantumEspresso, VASP). | 4D (HKLw) |
Creation: POSCAR,
CIF,
or PDB, ... Then, only the DHO line shape. ab-initio implies no (few) tunable parameter. |
| sqw_spinw | Spin-wave dispersion in HKL using SpinW. Ann initial
SpinW object must be given, or defaults to the 'squareAF'
with J1=2, J2=0 |
4D (HKLw)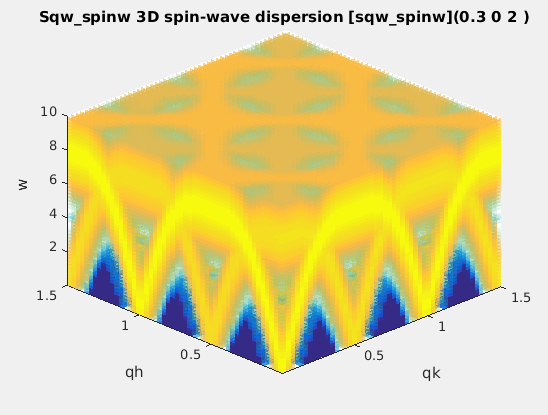 |
energy broadening, Temperature, Amplitude, coupling parameters J... |
| sqw_linquad | A phenomenological dispersion which can describe an acoustic or optical mode. This model can be considered as a local expansion in series of any dispersion. | 4D (HKLw) |
Energy and location of 'gap', slopes, directions of slopes, DHO width, temperature, background |
| sqw_acoustopt |
A phenomenological dispersion which can
describe an acoustic or optical mode.Acoustic slope and
'optical' minimum energy can be specified. |
4D (HKLw) |
Energy and location of 'gap', slopes, directions of slopes, DHO width, temperature, background |
s=sqw_sine3d; % create a 4D S(q,w) for a cubic pure material, using default parametersThen we evaluate both the ideal S(q,w) and its convolution with the 4D TAS resolution function, along the trajectory:
t=ResLibCal(s); % convolute it with a TAS resolution, and open ResLibCal.
w=linspace(0.01,10,50); qh=1.1*ones(size(w)); qk=0*qh; ql=0*qh; % an E-scan around the [1 0 0] BraggThe resulting signals are along the QH,QK,QL,W line, which is in 4D. To squeeze the singleton dimensions (which are constant) and generate 1D data sets along the energy axis, we use:
signal0=iData(s, [], qh,qk,ql,w); % the ideal model evaluated along the HKLE line
signal1=iData(t, [], qh,qk,ql,w); % the convoluted model evaluated along the HKLE line
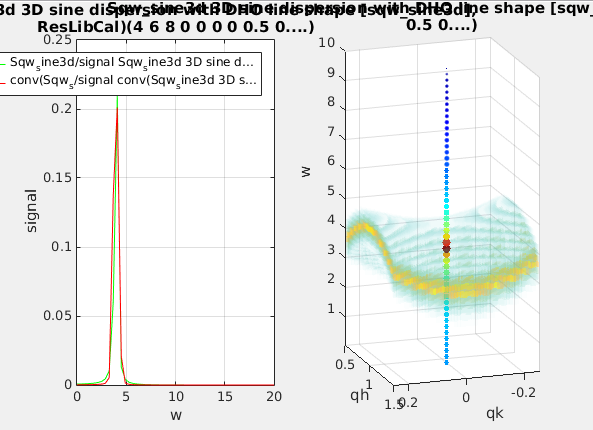
figure; plot(squeeze([signal0 signal1/100])); % plot the dispersion and simulated measurementThen we can plot the whole dispersion curve and the simulated signal along the given scan trajectory.
    QH=linspace(0,1.5,50); QK=linspace(-.25,.25,50);; QL=QK; W=linspace(0.01,10,51);	% a 4D grid
    f=iData(s,[],QH,QK,QL,W);						% evaluate the model on the 4D grid
    figure; plot3(log(f(:,:,25,:)));  					% plot dispersion
    hold on; scatter3(log(signal1(:,:,1,:)),'filled');			% overlay the simulated scan
E. Farhi, Y. Debab and P. Willendrup, J. Neut. Res., 17 (2013) 5. DOI: 10.3233/JNR-130001References: